by Paula Frendel - Posted 3 years ago
In this report, we study this question using Velocity Risk℠, a statistical database with deidentified information on vehicles and vehicle loans. The data are drawn from several different sources, including vehicle titles and registrations, auto lenders, and auto manufacturers. Importantly, the data include information on vehicle values and borrower credit scores for all vehicles purchased with a loan.
In this report we divide borrowers into one of four credit tiers: (1) “deep subprime” (with credit scores below 540), (2) “subprime” (with credit scores between 540 and 619), (3) “nonprime” (with credit scores between 620 and 679), and (4) “prime” (with credit scores of 680 or above). Categorizing borrowers according to credit score in this way is standard, although the definitions of the various tiers are not universal and different sources use different numeric cutoffs.
One might expect that, since consumers with deep subprime credit scores likely have the least financial cushion to absorb higher vehicle prices, they might have responded to recent price increases by buying less expensive vehicles. But their ability to do so may be limited. As documented in the previous CFPB blog post, between July 2020 and July 2022 new car prices increased by about 20 percent but used car prices increased by about 40 percent. Since car buyers with deep subprime credit scores are particularly likely to buy used vehicles, this could suggest that the prices of vehicles available to consumers with deep subprime credit scores have increased even faster than they have for other consumers. Figure 1 below provides evidence that this is the case. In our Velocity Risk℠ data, the median value of vehicles purchased by consumers with prime credit scores has increased by about 30 percent since 2019. For consumers with deep subprime credit scores, it has increased by about 60 percent.
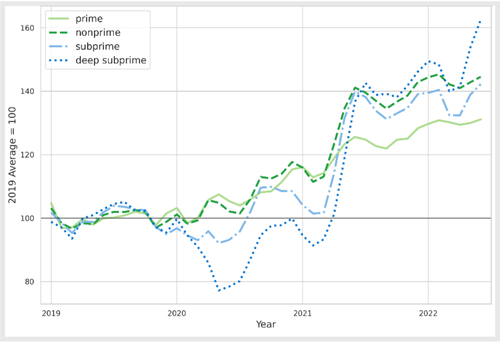
Figure 1: Median vehicle value relative to 2019
Besides buying less valuable vehicles, consumers might adjust to higher vehicle prices by forgoing buying vehicles at all. We can examine vehicle sales by credit tier in our data. But before we do so, we first note that (as discussed in
) consumers’ financial situations improved on average during the COVID pandemic, due in part to public and private COVID financial assistance programs. Among all consumers (whether buying a vehicle or not) the share of those with prime scores rose while the share of those with deep subprime scores fell. It is important to control for the fact that the total number of deep subprime consumers fell during the time period we study.The CCP and Velocity Risk℠ are different datasets, but we believe that the CCP is useful for understanding the total number of deep subprime consumers when analyzing Velocity Risk℠ data. In Figure 2 below we examine vehicle sales (from Velocity Risk℠) per consumer (from the CCP) by credit tier, relative to the number of vehicle sales per consumer in the same month in 2019. In a recent , researchers from the Federal Reserve Bank of New York found no evidence using credit bureau data (like our CCP) that consumers were responding to higher prices by purchasing fewer vehicles. Figure 2 confirms this finding for consumers with subprime or higher credit scores. But Figure 2 also shows that consumers with deep subprime credit scores -- many of whose loans do not show up in CCP data because information about their loans is not furnished to the provider of the CCP data -- have on average been purchasing many fewer vehicles since 2019. Indeed, average auto sales per deep subprime consumer have been between 10 and 40 percent below 2019 levels for most of the past two years.
It seems likely that many deep subprime consumers have been priced out of the auto loan market, at least temporarily. Unfortunately, available data don’t allow us to explore what these consumers are doing instead of buying vehicles. For example, they could be using their current vehicles for longer, using other forms of transportation, or forgoing some trips entirely.
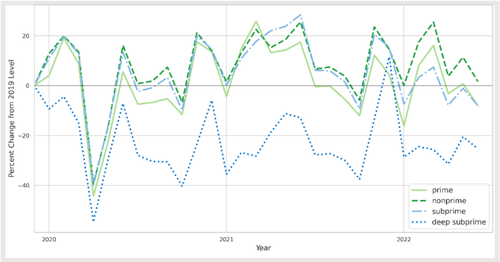
Figure 2: Number of sales per consumer relative to 2019
Our findings indicate to us that the rapid increase in vehicle prices has had the largest impacts on the most vulnerable consumers. To the extent possible, we will continue to monitor the important market for deep subprime auto loans. But as indicated above, there are important gaps in the data we have. In particular, we have no data on monthly payments or delinquency rates for auto loans that are not furnished to credit reporting companies, so with our current data resources we cannot study the important affordability concerns raised in this blog post. We will continue to seek additional data resources to learn more about this important market.
The views expressed here are those of the authors and do not necessarily reflect the views of the Consumer Financial Protection Bureau. Links or citations in this post do not constitute an endorsement by the Bureau.
| Mon: | 8:00am - 5:00pm |
| Tue: | 8:00am - 5:00pm |
| Wed: | 8:00am - 5:00pm |
| Thu: | 8:00am - 5:00pm |
| Fri: | 8:00am - 5:00pm |
| Sat: | Closed |
| Sun: | Closed |

This page has been visited 0 times since July 26th, 2026
New Jersey IADA has been visited 3,790,105 times.